Lyft Pricing Case Study
Lyft is recently launching its operations in Toledo, Ohio and the team wants to tackle a specific pricing case concerning the route between the airport and downtown.
Product Requirements Document (PRD)
Project Title: Toledo Airport–Downtown Route Pricing Optimization
Owner: Pricing Product Manager
Department: Product – Growth
Date: 11/04/2024
Status: Completed
1. Executive Summary
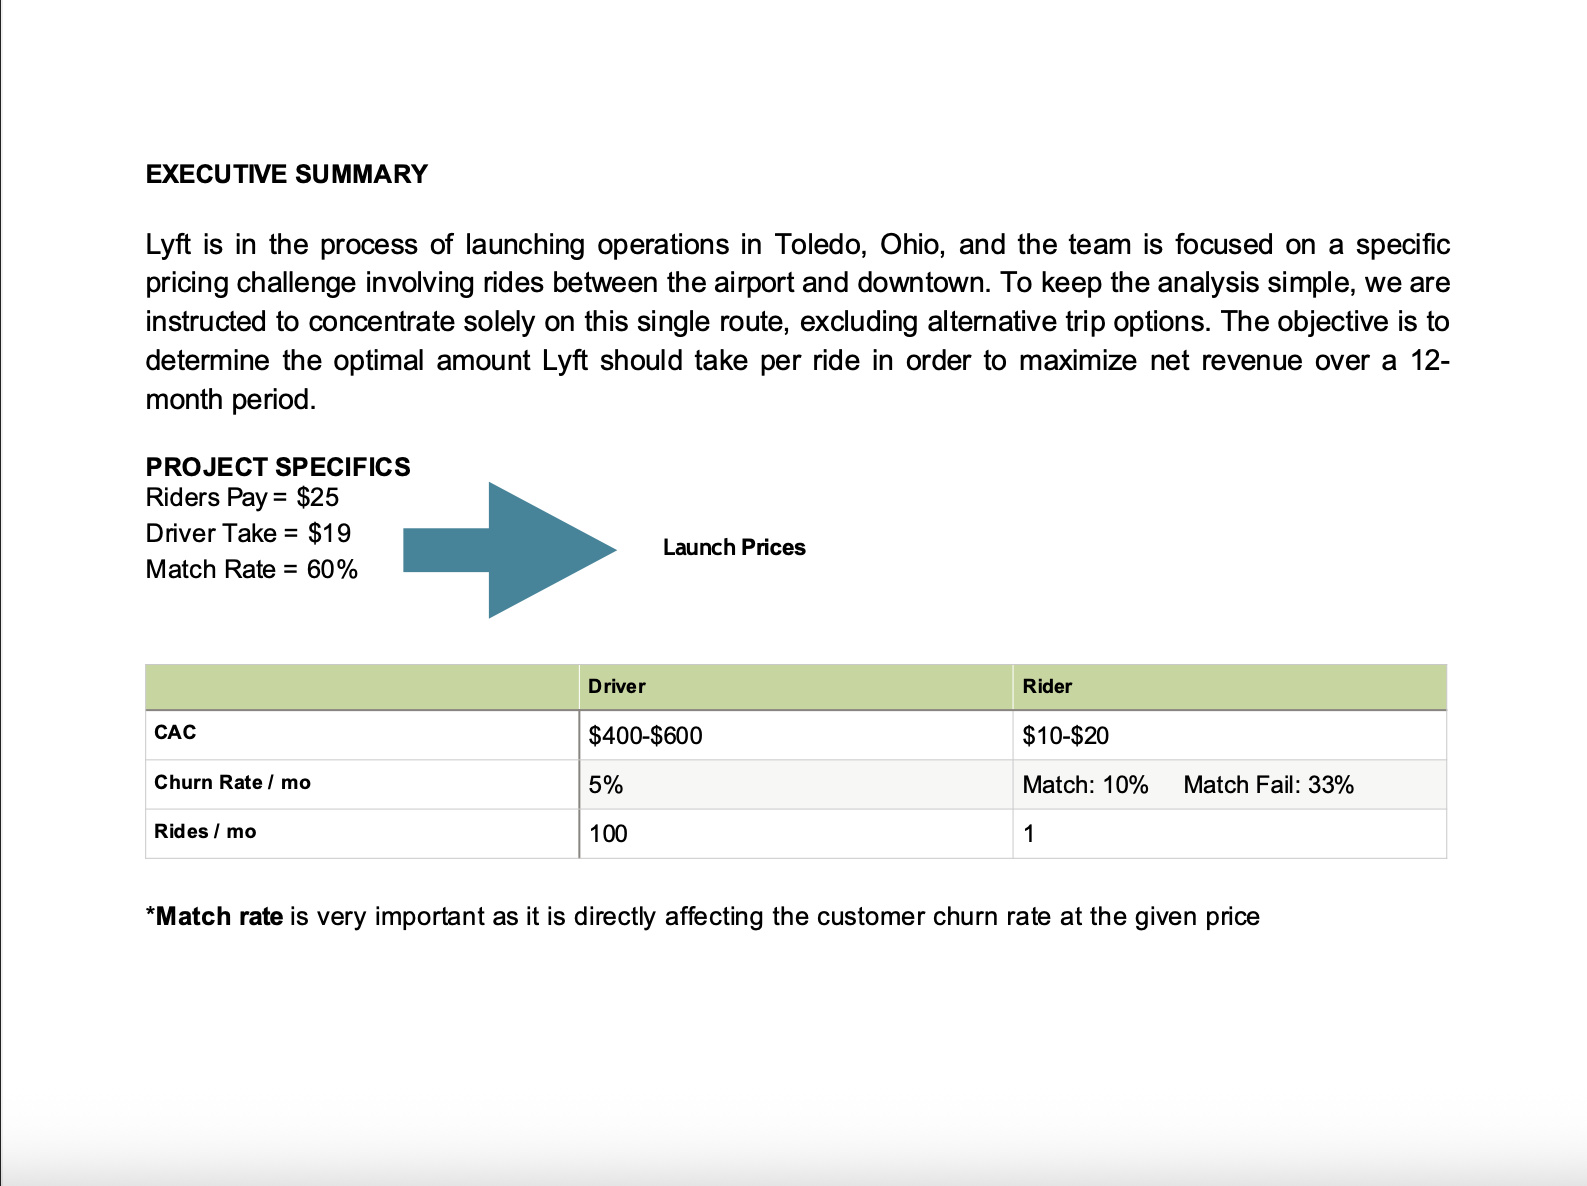
As part of Lyft's expansion strategy into new cities, this project focuses on pricing optimization for the high-demand route between Toledo Express Airport and Downtown Toledo.
Market benchmarks indicate a prevailing rider fare of $25 and a driver payout of $19. Our launch adhered to these levels. However, early data shows a 60% ride match rate, signaling significant supply-side inefficiency. A recent pricing experiment revealed that decreasing Lyft’s take rate (and increasing driver payout) dramatically improved match rates to 93%.
Our goal is to determine the optimal Lyft take per ride to maximize 12-month net revenue from this route, without raising the rider fare beyond $25.
2. Objective
Primary Objective: Maximize Lyft's net revenue over the next 12 months for the Toledo Airport–Downtown route by optimizing the driver payout (i.e., Lyft's commission).
3. Problem Statement
Initial market adoption indicates a mismatch between rider demand and driver supply at the prevailing payout rate. Only 60% of rider requests are successfully matched, primarily due to insufficient driver compensation.
This supply constraint leads to increased rider churn, particularly when users encounter failed match events (33% churn vs. 10% otherwise). Driver churn is also sensitive to payout levels, influencing long-term ride capacity. Without adjusting payout levels, the route may not reach its full revenue potential.
4. Constraints
Rider fare must remain fixed at $25.
Focus is limited to the Toledo Airport–Downtown route.
5. Economic Inputs
5.1 Driver Unit Economics
Customer Acquisition Cost (CAC): $400–$600
Monthly churn at $19 payout: 5%
Average rides per month: 100
5.2 Rider Unit Economics
CAC: $10–$20
Monthly rides per rider: 1
Monthly churn:
10% if match success
33% if match fails
6. Key Insights from Initial Experimentation
Pricing Experiment I
Lyft's take reduced from $6 → $3
Match rate increased from 60% → 93%
Indicates high price elasticity of driver supply
Interpretation
Higher driver payouts significantly improve fulfillment and reduce churn
Lower Lyft take reduces per-ride margin but increases ride volume and customer LTV
7. Proposed Methodology
Step 1: Model match rate as a function of driver payout
Use linear regression from experimental data points ($3–$6 Lyft take)
Step 2: Calculate monthly churn for riders based on match success probability
Step 3: Forecast active users, ride demand, completed rides, and net revenue across a range of Lyft take rates
Step 4: Identify optimal Lyft commission that maximizes total net revenue across 12 months
8. Assumptions
Match rate increases linearly between take rates of $3 and $6
Fixed population of 1,000 monthly active riders in Toledo
Rider and driver churn rates are assumed to reflect the provided averages and are modeled as functions of match success and compensation, allowing for proportional adjustment as pricing variables change
9. Success Metrics
Optimal Lyft commission (take rate)
12-month cumulative net revenue
10. Risks & Mitigations
11. Next Steps
Finalize regression modeling and simulation of scenarios (3.0–6.0 Lyft take)
Validate assumptions with broader data sources
Present pricing recommendation to stakeholders
Monitor KPIs post-implementation (conversion, churn, net revenue)

ANALYSIS AND INSIGHTS